It is currently July 27th, 2024, 6:25 am
Gadgets 7.7.0 - inspired by AddGadgets.com Sidebar Gadgets
-
iieeann

- Posts: 26
- Joined: September 8th, 2017, 12:29 am
Re: Gadgets 6.1.1 - inspired by AddGadgets.com Sidebar Gadgets
Thanks, got it working.
Laptop : Dell Precision 7720, E3-1535M v6, P5000, 8TB SSD. Windows 10.21H1
-
takayo72
- Posts: 6
- Joined: January 9th, 2020, 1:28 pm
Re: Gadgets 6.1.1 - inspired by AddGadgets.com Sidebar Gadgets
isnt there has no cpu, chassis fan monitor widget ?
-
SilverAzide

- Rainmeter Sage
- Posts: 2692
- Joined: March 23rd, 2015, 5:26 pm
Re: Gadgets 6.1.1 - inspired by AddGadgets.com Sidebar Gadgets
The CPU fan and GPU fan can be monitored, but there is no Gadget that is dedicated to other fans. However, you might be interested in Gadgets Additions, also here and here.
There is a generic HWiNFO skin, HWiNFO Monitor, that will allow you to monitor up to 20 different sensors, and it integrates into the Gadgets suite appearance. You can easily configure this to show any or all chassis fans, or anything else that HWiNFO can see.
-
olenbr
- Posts: 26
- Joined: December 30th, 2017, 4:58 am
Re: Gadgets 6.1.1 - inspired by AddGadgets.com Sidebar Gadgets
how can I get the cpu meter to show two charts, for dual CPUs?SilverAzide wrote: ↑June 12th, 2021, 12:42 am The CPU fan and GPU fan can be monitored, but there is no Gadget that is dedicated to other fans. However, you might be interested in Gadgets Additions, also here and here.
There is a generic HWiNFO skin, HWiNFO Monitor, that will allow you to monitor up to 20 different sensors, and it integrates into the Gadgets suite appearance. You can easily configure this to show any or all chassis fans, or anything else that HWiNFO can see.
-
iieeann
- Posts: 26
- Joined: September 8th, 2017, 12:29 am
Re: Gadgets 6.1.1 - inspired by AddGadgets.com Sidebar Gadgets
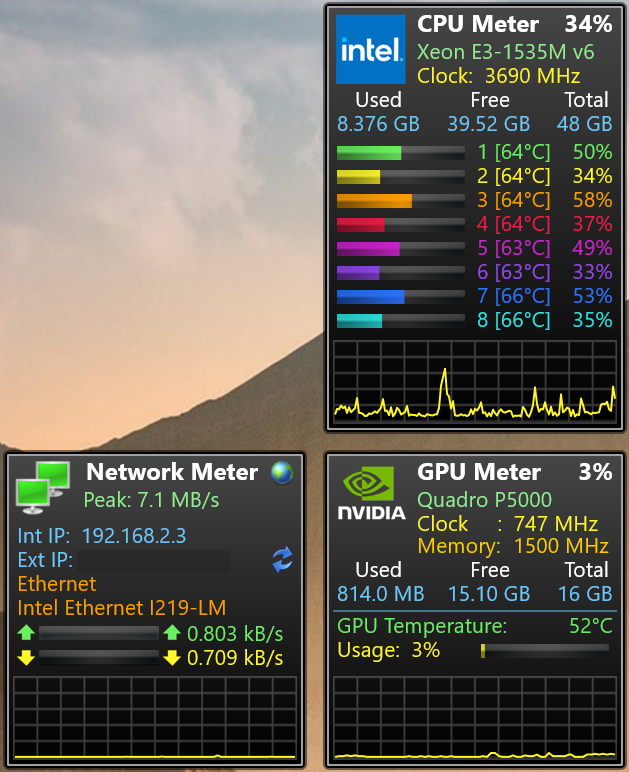
I am having above 100% CPU utilization reported in CPU meter, what went wrong? i did not alter the measurement string.
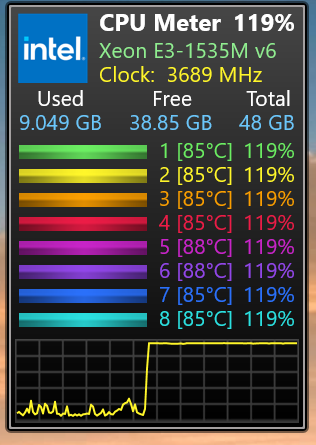
Laptop : Dell Precision 7720, E3-1535M v6, P5000, 8TB SSD. Windows 10.21H1
-
SilverAzide
- Rainmeter Sage
- Posts: 2692
- Joined: March 23rd, 2015, 5:26 pm
Re: Gadgets 6.1.1 - inspired by AddGadgets.com Sidebar Gadgets
Hi! This is normal actually. Check out this article on the wiki: INFO: CPU performance exceeds 100%.
If you prefer the older Windows 7/Rainmeter-style performance monitoring, check the Use Legacy Mode option in the CPU Settings.
-
SilverAzide
- Rainmeter Sage
- Posts: 2692
- Joined: March 23rd, 2015, 5:26 pm
Re: Gadgets 6.1.1 - inspired by AddGadgets.com Sidebar Gadgets
OK, there are a couple issues to consider.
First, both Windows and the CPU Meter monitor logical cores. So Windows doesn't normally "see" two separate sockets, it just sees a bunch of cores all combined together in a single logical CPU. The CPU Meter will show up to 64 logical cores (I have not extended it beyond that [yet?], as the skin gets hard to deal width and super tall).
Second, to alter the existing skin to show dual (or more) sockets is actually rather difficult. I've been trying to do this for a long time, and I really have not gotten very far because it will essentially mean rewriting a lot of the skin logic. My approach (so far) is to create separate CPU Meters in the same manner as the separate GPU Meters, so you'd have a separate CPU Meter for each socket. This means the skin logic needs to switch to monitor physical cores and map them to logical cores (or vice versa); alternatively, a skin that is based entirely on HWiNFO (like the GPU Meters) would make this simpler, but so far I have not tried this approach.
So to answer your exact question, you CAN create two charts for two sockets, but the solution would only work for you. Basically, increase the height of the CPU Meter and tack on a second graph at the bottom. Then, assign/move the Line meters corresponding to the logical CPUs that apply to socket 1 to one graph, and assign the Line meters for the cores corresponding to socket 2 to the other. (So add a graph and re-position some of the existing line meters; it is actually not terribly difficult.) But remember that the skin is still limited to 64 logical cores, so if you have more cores than that you'll need to do a lot more work.
In the back of my mind, someday I would like to have the ability for the CPU Meter to handle multi-socket machines, but so far I have not gotten very far due to the amount of effort involved. Perhaps I'll start on this if there is a lot of interest out there...
-
APK17
- Posts: 13
- Joined: June 21st, 2021, 11:39 pm
Re: Gadgets 6.1.1 - inspired by AddGadgets.com Sidebar Gadgets
Some how my CPU Meter (AMD Ryzen 9) has started showing 0% utilization on all cores all the time. I'm not sure what I did to bugger it up. Any ideas what I should check or reset?
Thank you
Edit: The chart shows CPU usage.
Thank you
Edit: The chart shows CPU usage.
-
SilverAzide
- Rainmeter Sage
- Posts: 2692
- Joined: March 23rd, 2015, 5:26 pm
Re: Gadgets 6.1.1 - inspired by AddGadgets.com Sidebar Gadgets
Sounds like a classic case of a corrupted performance counter database. The good news is it's not your fault and you can blame Microsoft... sometimes it just happens.
HOW TO: Fix your Performance Counters database
-
olenbr
- Posts: 26
- Joined: December 30th, 2017, 4:58 am
Re: Gadgets 6.1.1 - inspired by AddGadgets.com Sidebar Gadgets
hey, could you pls help me, i'm getting stuck on trying to get chart to show correct sensors on the corresponding CPU.SilverAzide wrote: ↑June 22nd, 2021, 12:29 am Sounds like a classic case of a corrupted performance counter database. The good news is it's not your fault and you can blame Microsoft... sometimes it just happens.But the best news is that it's super easy to fix:
HOW TO: Fix your Performance Counters database
I first duplicated CPU meter and have a 2nd meter, call it ALL CPU METER2.ini. it still loads everything else the same but in that file I replaced all "CPU0" with "CPU1" and then refresh the meter, still no luck, both meter show loads the same on same processor.
in 2nd screenshot I compare HWINFO.inc side by side, the CPU1 and CPU0 values are both the same?
not sure what I am missing here.
You do not have the required permissions to view the files attached to this post.