It is currently May 3rd, 2024, 11:52 pm

Creating a range/floating bar graph

Get help with creating, editing & fixing problems with skins
Falxon
Posts: 12
Joined: May 5th, 2020, 3:04 pm

Creating a range/floating bar graph

Post by Falxon »

Hey folks,

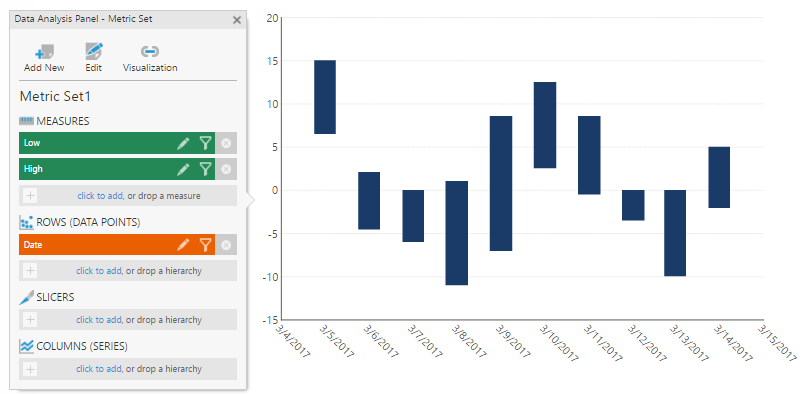
I was hoping you could point me in the right direction to do something like this. I wanted to create a range bar graph to plot some temperature data. An example of this style of graph is this one:

Image

I was thinking I could create 2 overlapping bars - one that was the low value and one that was the high value. That would get me to the result, but it is a hack and the bottom bar would not be transparent. Is there a way to do this style of graph where the bar is the only thing showing and I can have the rest be a transparent background?

Your help is much appreciated!
User avatar
balala
Rainmeter Sage
Posts: 16198
Joined: October 11th, 2010, 6:27 pm
Location: Gheorgheni, Romania

Re: Creating a range/floating bar graph

Post by balala »

Falxon wrote: May 29th, 2020, 4:35 pm I was thinking I could create 2 overlapping bars - one that was the low value and one that was the high value. That would get me to the result, but it is a hack and the bottom bar would not be transparent. Is there a way to do this style of graph where the bar is the only thing showing and I can have the rest be a transparent background?
Actually there are even more possibilities. Here is one of them. This doesn't use a Bar meter, but a Shape. For instance take a look to the following code:

Code: Select all

[Rainmeter]
Update=-1

[Variables]
Stat=0

[MeasureStat]
Measure=Calc
Formula=#Stat#
IfCondition=(#CURRENTSECTION#=0)
IfTrueAction=[!SetOption MeterChart Shape3 "Combine Shape | Union Shape2"][!UpdateMeter "MeterChart"][!Redraw]
IfCondition2=(#CURRENTSECTION#=1)
IfTrueAction2=[!SetOption MeterChart Shape3 "Combine Shape | Intersect Shape2"][!UpdateMeter "MeterChart"][!Redraw]
IfCondition3=(#CURRENTSECTION#=2)
IfTrueAction3=[!SetOption MeterChart Shape3 "Combine Shape | XOR Shape2"][!UpdateMeter "MeterChart"][!Redraw]
DynamicVariables=1

[MeterChart]
Meter=Shape
X=2
Y=2
Shape=Rectangle 0,0,30,200 | Extend MyModifiers1
Shape2=Rectangle 0,150,30,50 | Extend MyModifiers2
Shape3=Combine Shape | Intersect Shape2
MyModifiers1=Fill Color 191,237,239,255 | StrokeWidth 2 | Stroke Color 46,115,31,255
MyModifiers2=Fill Color 255,0,0,255 | StrokeWidth 2 | Stroke Color 46,115,31,255
LeftMouseUpAction=[!SetVariable Stat "((#Stat#+1)%3)"][!UpdateMeasure "MeasureStat"]
DynamicVariables=1
Click the shape more times when you load the skin.
Falxon
Posts: 12
Joined: May 5th, 2020, 3:04 pm

Re: Creating a range/floating bar graph

Post by Falxon »

balala wrote: May 29th, 2020, 5:48 pm Actually there are even more possibilities. Here is one of them. This doesn't use a Bar meter, but a Shape. For instance take a look to the following code:

Click the shape more times when you load the skin.
A brilliant idea! I did not think about a shape meter... Now I need to really dig in and understand the logic in your example and go off and prototype a bit... :D
User avatar
balala
Rainmeter Sage
Posts: 16198
Joined: October 11th, 2010, 6:27 pm
Location: Gheorgheni, Romania

Re: Creating a range/floating bar graph

Post by balala »

Falxon wrote: May 29th, 2020, 6:14 pm A brilliant idea! I did not think about a shape meter... Now I need to really dig in and understand the logic in your example and go off and prototype a bit... :D
You could give a source for the needed information you want to show up on your chart. Just me to dig in as well, to get the possible hidden pitfalls (because there might be).
Falxon
Posts: 12
Joined: May 5th, 2020, 3:04 pm

Re: Creating a range/floating bar graph

Post by Falxon »

balala wrote: May 29th, 2020, 6:23 pm You could give a source for the needed information you want to show up on your chart. Just me to dig in as well, to get the possible hidden pitfalls (because there might be).
Basically, I'm looking to create a weather forecast display that uses data that shows a low/high temp for each day in a 10-day series. The goal would be to show a series of floating bars for the temperature range per day so you can visualize the weather trend very easily. I like the look of floating columns more than stacked bars hence where I am starting. Like the attached Excel mockup, basically:
Annotation 2020-05-29 151529.png
I have the basic formulas done to map from a source temperature range to a vertical pixel range, and the XOR makes perfect sense, so now I am just toying with getting the rectangles to appear where I want.
You do not have the required permissions to view the files attached to this post.
Falxon
Posts: 12
Joined: May 5th, 2020, 3:04 pm

Re: Creating a range/floating bar graph

Post by Falxon »

As a follow-up, I have it working using this code, but obviously with mockup data. The Value1Lo/Value1Hi variables would actually come in via a webparser.

Code: Select all

[Rainmeter]
Update=-1

[Variables]
InputMin=30
InputMax=80

OutputMin=0
OutputMax=200

Value1Lo=46
Value1Hi=52
Value2Lo=30
Value2Hi=40
Value3Lo=61
Value3Hi=74

[MeasureScaleFactor]
Measure=Calc
Formula=(#OutputMax# - #OutputMin#) / (#InputMax# - #InputMin#)
DynamicVariables=1


[MeasureV1L]
Measure=Calc
# Scale input temperature to pixel value
Formula=#OutputMax# - ((#Value1Lo# - #InputMin#) * [MeasureScaleFactor]) + #OutputMin#
DynamicVariables=1

[MeasureV1H]
Measure=Calc
# Scale input temperature to pixel value
Formula=#OutputMax# - ((#Value1Hi# - #InputMin#) * [MeasureScaleFactor]) + #OutputMin#
DynamicVariables=1

[MeasureV1Delta]
Measure=Calc
Formula=[MeasureV1H] - [MeasureV1L]
DynamicVariables=1


[MeasureV2L]
Measure=Calc
# Scale input temperature to pixel value
Formula=#OutputMax# - ((#Value2Lo# - #InputMin#) * [MeasureScaleFactor]) + #OutputMin#
DynamicVariables=1

[MeasureV2H]
Measure=Calc
# Scale input temperature to pixel value
Formula=#OutputMax# - ((#Value2Hi# - #InputMin#) * [MeasureScaleFactor]) + #OutputMin#
DynamicVariables=1

[MeasureV2Delta]
Measure=Calc
Formula=[MeasureV2H] - [MeasureV2L]
DynamicVariables=1


[MeasureV3L]
Measure=Calc
# Scale input temperature to pixel value
Formula=#OutputMax# - ((#Value3Lo# - #InputMin#) * [MeasureScaleFactor]) + #OutputMin#
DynamicVariables=1

[MeasureV3H]
Measure=Calc
# Scale input temperature to pixel value
Formula=#OutputMax# - ((#Value3Hi# - #InputMin#) * [MeasureScaleFactor]) + #OutputMin#
DynamicVariables=1

[MeasureV3Delta]
Measure=Calc
Formula=[MeasureV3H] - [MeasureV3L]
DynamicVariables=1

[MeterChart1]
Meter=Shape
X=0
Y=2
Shape=Rectangle 0,0,30,[MeasureV1H] | Extend MyModifiers1
Shape2=Rectangle 0,0,30,[MeasureV1L] | Extend MyModifiers2
Shape3=Combine Shape | XOR Shape2

MyModifiers1=Fill Color 191,237,239,255 | StrokeWidth 2 | Stroke Color 46,115,31,255
MyModifiers2=Fill Color 255,0,0,255 | StrokeWidth 2 | Stroke Color 46,115,31,255

DynamicVariables=1
[MeterChart2]
Meter=Shape
X=40r
Y=2
Shape=Rectangle 0,0,30,[MeasureV2H] | Extend MyModifiers1
Shape2=Rectangle 0,0,30,[MeasureV2L] | Extend MyModifiers2
Shape3=Combine Shape | XOR Shape2

MyModifiers1=Fill Color 191,237,239,255 | StrokeWidth 2 | Stroke Color 46,115,31,255
MyModifiers2=Fill Color 255,0,0,255 | StrokeWidth 2 | Stroke Color 46,115,31,255

DynamicVariables=1

[MeterChart3]
Meter=Shape
X=40r
Y=2
Shape=Rectangle 0,0,30,[MeasureV3H] | Extend MyModifiers1
Shape2=Rectangle 0,0,30,[MeasureV3L] | Extend MyModifiers2
Shape3=Combine Shape | XOR Shape2

MyModifiers1=Fill Color 191,237,239,255 | StrokeWidth 2 | Stroke Color 46,115,31,255
MyModifiers2=Fill Color 255,0,0,255 | StrokeWidth 2 | Stroke Color 46,115,31,255

DynamicVariables=1
Last edited by Falxon on May 29th, 2020, 7:30 pm, edited 1 time in total.
User avatar
balala
Rainmeter Sage
Posts: 16198
Joined: October 11th, 2010, 6:27 pm
Location: Gheorgheni, Romania

Re: Creating a range/floating bar graph

Post by balala »

Falxon wrote: May 29th, 2020, 6:59 pm I have the basic formulas done to map from a source temperature range to a vertical pixel range, and the XOR makes perfect sense, so now I am just toying with getting the rectangles to appear where I want.
Alright, please feel free to come back if any further questions arise.
User avatar
balala
Rainmeter Sage
Posts: 16198
Joined: October 11th, 2010, 6:27 pm
Location: Gheorgheni, Romania

Re: Creating a range/floating bar graph

Post by balala »

Falxon wrote: May 29th, 2020, 7:25 pm The Value1Lo/Value1Hi variables would actually come in via a webparser.
Probably you're right, those values will be returned by WebParser measures, indeed. But at least the code seems to be working, right?

Two additional comments, related to your code:
  • When you gonna use WebParser measures instead of static variables, replace the Update=-1 option within the [Rainmeter] section with the default Update=1000. Update=-1 in most cases is not suitable for skins using WebParser measures, because the skins with Update set to -1, are never updated and since the WebParser measures need time (at few seconds) until they get their data, the skin not being updated after this, it shows nothing. I probably would also add a DynamicWindowSize=1 option to the same [Rainmeter] section, to not get the shown information truncated once the WebParser measures get their data.
  • In Rainmeter the comments are done with ;, not with #. For instance the # Scale input temperature to pixel value line of the [MeasureV1L] measure should be ; Scale input temperature to pixel value.
Falxon
Posts: 12
Joined: May 5th, 2020, 3:04 pm

Re: Creating a range/floating bar graph

Post by Falxon »

balala wrote: May 29th, 2020, 7:40 pm Probably you're right, those values will be returned by WebParser measures, indeed. But at least the code seems to be working, right?

Two additional comments, related to your code:
...
Good points, thanks! One issue I have noticed is if I have other plugins (such as the JsonParser) plugin that depend on the webparser output, I have to set those measures to "Disabled=1" and then on the webparser measure add a line:

Code: Select all

FinishAction=[!SetOption ExampleMeasureUsingWebParser Disabled 0]
I get that this is due to all measures being updated in parallel, but is there a more elegant way of doing it? Currently, I end up with a big chain of this stuff attached to my webparser:

Code: Select all

OnUpdateAction=[!SetOption mForecast0.Text Disabled 0] [!SetOption mForecast0.Lo Disabled 0] [!SetOption mForecast0.Hi Disabled 0]
User avatar
balala
Rainmeter Sage
Posts: 16198
Joined: October 11th, 2010, 6:27 pm
Location: Gheorgheni, Romania

Re: Creating a range/floating bar graph

Post by balala »

Falxon wrote: May 29th, 2020, 8:35 pm One issue I have noticed is if I have other plugins (such as the JsonParser) plugin that depend on the webparser output, I have to set those measures to "Disabled=1" and then on the webparser measure add a line:

Code: Select all

FinishAction=[!SetOption ExampleMeasureUsingWebParser Disabled 0]
If those measures are using any result returned by the WebParser measure or one of its child measures, they can't work until the WebParser measures are getting their values, because previously, the subsequent measures, not having the needed information, gonna give error messages. But these WebParser measures need a few seconds to get the information, that's why you have to disable the related measures, then enable them when the WebParser measure finished its job.
But even if this does work, I'd be tempted to, instead of enabling the measure by setting their Disabled option to 0, use the !EnableMeasure bang. For instance instead of [!SetOption ExampleMeasureUsingWebParser Disabled 0] a much more elegant solution is something like [!EnableMeasure "ExampleMeasureUsingWebParser"].
Don't misunderstand me, your solution (setting the Disabled option to 0) definitely works, but at least for me, this seems a much more elegant solution.