It is currently June 28th, 2024, 3:58 am
GPU monitor
-
djk
- Posts: 1
- Joined: July 14th, 2021, 1:48 pm
GPU monitor
Is there support for GPU and video ram monitoring? I have searched but not found anything that works with nVidia.
-
jsmorley

- Developer
- Posts: 22642
- Joined: April 19th, 2009, 11:02 pm
- Location: Fort Hunt, Virginia, USA
-
SilverAzide

- Rainmeter Sage
- Posts: 2676
- Joined: March 23rd, 2015, 5:26 pm
Re: GPU monitor
In addition to the above, you can use the third-party utility HWiNFO to monitor your system. It is then possible for Rainmeter skins to interact with HWiNFO to get detailed GPU information.
-
Yincognito

- Rainmeter Sage
- Posts: 7551
- Joined: February 27th, 2015, 2:38 pm
- Location: Terra Yincognita
Re: GPU monitor
When it comes to usage monitoring, the native UsageMonitor plugin linked by jsmorley will do the job. When it comes to temperatures, fans and harware sensor related stuff, 3rd party software like HWiNFO linked by SilverAzide or MSI Afterburner will do the job.
For the latter case, you will need to:
- have that 3rd party monitoring software installed and running
- download its associated plugin for Rainmeter, so the latter can "see" those monitored values (a simple googling after "hwinfo plugin rainmeter" or "msi afterburner plugin rainmeter" will show you the way)
- use the above plugin's measures to display the desired data in your skin code
-
ReActif

- Posts: 4
- Joined: August 26th, 2014, 5:51 am
Re: GPU monitor
So I don't know if some people understood the request correctly and saw that their response was off topic?
Here we are talking about the fact that with the plugin we cannot get the GPU usage reliably, I also have this problem, which I tested with Index=0 1 or -1 (I detail it below) we never get the total usage of the GPU!
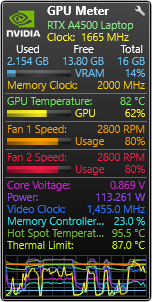
So all the tools that were given as a solution, if you look closely at the screenshots that you provided, they do not even provide the information that is requested! We have the fan speed, the VRAM load, and the temperature or the various frequencies but you absolutely do not have the total load of the chip!
Moreover, even software like Process Explorer to replace the task manager does not itself provide the exact information because each GPU is made up of several Cores or Engines and the loads are not easy to understand, they are separated into several parts.
For example with Process Explorer to have the GPU load for a process, no problem, we have the exact information but to have the information on the total load even he is wrong, we can have a game which loads on its own 30% the GPU but when we look at the total load indicated by the software, we obtain 4% or even 0%.
With Rainmeter, it's the same, we have several indexes and none is perfect! ^ The total load of all instances (but is not correct, even with a process that uses 30% here we sometimes obtain 0%)
^ The load average of all instances (same problem)
^ The highest load (then works to know the use of what takes the most GPU load but it's not all of it either)
Of all the tests carried out with software to push the load to 100% and compare, I have never found completely reliable parameters.
And no software that provides me with the desired information.
In the absence of a good solution, I recommend using This will be closer to the real use of the GPU!
Or we should test by having several measures where we retrieve the different indexes and add them but hey it quickly becomes complex.
Here we are talking about the fact that with the plugin we cannot get the GPU usage reliably, I also have this problem, which I tested with Index=0 1 or -1 (I detail it below) we never get the total usage of the GPU!
So all the tools that were given as a solution, if you look closely at the screenshots that you provided, they do not even provide the information that is requested! We have the fan speed, the VRAM load, and the temperature or the various frequencies but you absolutely do not have the total load of the chip!
Moreover, even software like Process Explorer to replace the task manager does not itself provide the exact information because each GPU is made up of several Cores or Engines and the loads are not easy to understand, they are separated into several parts.
For example with Process Explorer to have the GPU load for a process, no problem, we have the exact information but to have the information on the total load even he is wrong, we can have a game which loads on its own 30% the GPU but when we look at the total load indicated by the software, we obtain 4% or even 0%.
With Rainmeter, it's the same, we have several indexes and none is perfect!
Code: Select all
Index=0Code: Select all
Index=-1Code: Select all
Index=1Of all the tests carried out with software to push the load to 100% and compare, I have never found completely reliable parameters.
And no software that provides me with the desired information.
In the absence of a good solution, I recommend using
Code: Select all
Index=1Or we should test by having several measures where we retrieve the different indexes and add them but hey it quickly becomes complex.
($toBe || !$toBe) == this.theQuestion();
-
Yincognito
- Rainmeter Sage
- Posts: 7551
- Joined: February 27th, 2015, 2:38 pm
- Location: Terra Yincognita
Re: GPU monitor
It's not so simple as you put it, but yeah, there are some particularities when it comes to process monitoring that are not what a regular user would expect - you'll have to ask Microsoft about that, though I'm pretty sure what they report is correct... just from that perspective / methodology (which again, might not be what the user expects). It's the same for the CPU side of it, by the way, and SilverAzide posted in length about that.ReActif wrote: ↑June 22nd, 2024, 9:38 am So I don't know if some people understood the request correctly and saw that their response was off topic?
Here we are talking about the fact that with the plugin we cannot get the GPU usage reliably, I also have this problem, which I tested with Index=0 1 or -1 (I detail it below) we never get the total usage of the GPU!
So all the tools that were given as a solution, if you look closely at the screenshots that you provided, they do not even provide the information that is requested! We have the fan speed, the VRAM load, and the temperature or the various frequencies but you absolutely do not have the total load of the chip!
In an abstract view, the total GPU usage, just like the CPU one, is a combination of what's being reported as its total usage (62% in SilverAzide's screenshot), its core clock (1665 MHz there) and probably a few other factors, depending on how the former is computed. The process GPU usage, on the other hand, is typically computed in a different way, and you will almost never see the GPU usage of all processes being equal to the (non-process related) total GPU usage, like you'd logically expect.
Neither Rainmeter, the folks responding here, or the other tools you tried are at fault for this, that's simply how Microsoft and its Windows are reporting things, based on formulas and conventions that (along with the reasons why) not even the folks answering on their behalf on their sites fully understand. All that these tools do is report what the OS and hardware are providing and try to guess how it's all computed and how to better align their reporting to the OS / Task Manager one (and not necessarily because Task Manager is terribly consistent in that regard, but because it is the standard that most users consider "correct" or "expected").
-
Bekarfel
- Posts: 217
- Joined: May 16th, 2012, 5:38 am
Re: GPU monitor
I Loled when I used the UsageMonitor VRAM alias and discovered it reports over 214 G VRAM on my RTX 3060 12 gig card. Now, the problem could be the hardware, or it could be the software, or the problem could be me.
I went out on a limb and said the problem was me because I don't understand what the VRAM, and VRAMSHARED aliases are doing. Maybe the problem is in the documentation and I need to look into the sauce to see what the program thinks it is doing and go from there, or maybe I just need to find the right hammer for this screw.
I went out on a limb and said the problem was me because I don't understand what the VRAM, and VRAMSHARED aliases are doing. Maybe the problem is in the documentation and I need to look into the sauce to see what the program thinks it is doing and go from there, or maybe I just need to find the right hammer for this screw.
moshi wrote:there are many Rainmeter skins that aren't really useful, so let's add another one.
jsmorley wrote:I have good news and bad news.
First the bad news. [...] We would be happy to have this happen and would love to work with anyone who is feeling ambitious.
Now the good news.
I lied, there isn't any good news...
-
Yincognito
- Rainmeter Sage
- Posts: 7551
- Joined: February 27th, 2015, 2:38 pm
- Location: Terra Yincognita
Re: GPU monitor
It's relatively easy to find out what the problem was, and sometimes the documentation about it, by running PerfMon.exe, and add the desired counters (in this case, GPU Process Memory > Dedicated Usage, aka the VRAM alias in UsageMonitor): Now, as you see after checking Show Description, it's not much of a documentation in this case, but you can look online for it, e.g. Microsoft sites, StackOverflow, etc. As for the reported value, UsageMonitor should get the same stuff listed in PerfMon.exe, so maybe the unit conversion (I'm assuming the above values are in bytes) in your skin is the culprit (below, what it shows for me, I have an integrated 500 MB AMD Radeon Vega GPU and a dedicated 4 GB NVidia GeForce GTX 1650 GPU on my laptop):Bekarfel wrote: ↑June 23rd, 2024, 3:31 pm I Loled when I used the UsageMonitor VRAM alias and discovered it reports over 214 G VRAM on my RTX 3060 12 gig card. Now, the problem could be the hardware, or it could be the software, or the problem could be me.
I went out on a limb and said the problem was me because I don't understand what the VRAM, and VRAMSHARED aliases are doing. Maybe the problem is in the documentation and I need to look into the sauce to see what the program thinks it is doing and go from there, or maybe I just need to find the right hammer for this screw.
Code: Select all
[Rainmeter]
Update=1000
AccurateText=1
DynamicWindowSize=1
BackgroundMode=2
SolidColor=0,255,0,255

[VRAM]
Measure=Plugin
Plugin=UsageMonitor
Alias=VRAM
Index=0

[VRAMforScaling]
Measure=Calc
Formula=VRAM

[MeterHighestUsedRAM]
Meter=String
MeasureName=VRAM
MeasureName2=VRAMforScaling
AutoScale=1
NumOfDecimals=1
DynamicVariables=1
Text=%1 : %2BYou do not have the required permissions to view the files attached to this post.