It is currently April 18th, 2024, 11:49 pm

ModernGadgets 1.8.2

A package of skins with a "theme" or by a single author
User avatar
ryouji
Posts: 5
Joined: July 11th, 2020, 11:39 am

Re: ModernGadgets 1.6.3

Post by ryouji »

Symptoms have improved.
Thank you for the information.
SilverAzide wrote: July 12th, 2020, 10:01 pm Aha, that's good info, thank you! It appears your Windows performance counter database is corrupted. Follow the instructions at the link below, then reboot and see if the CPU Meter behaves normally.

PerfMon Troubleshooting
How to Fix High CPU Usage
Run PerfMon Troubleshooting
CPU consumption drastically reduced

Image

When a PC is forcibly shut down due to a blue screen, etc., the database of performance counters may be corrupted, very rarely. If this happens, you will not be able to obtain information using PerfCounter.dll or ServiceModelPerformanceCounters.dll. When I updated the display driver, this symptom appeared after the BSOD burst, and I thought that these DLL files were damaged at first, but I tried reinstalling the .NET Framework but it did not revive, and I was searching for the cause further, I found out that there is a performance counter library. Certainly, binary data is written to CounterBlock in the registry, unlike DLL. This is DB. The command to rebuild and repair the DB of the library is as follows.

Code: Select all

cd C:\Windows\System32
lodctr /R
cd C:\Windows\SysWOW64
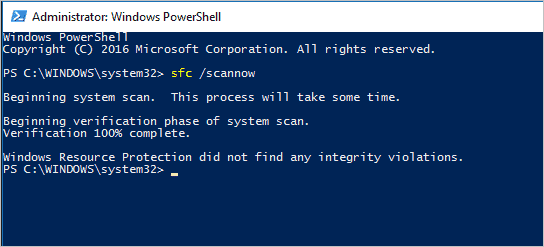
lodctr /R
Normally, if you start the command prompt in administrator mode, System32 is the first time, so the cd in the first line is not necessary, but execute the same command with SysWOW64. Switch directories because you need to. This completes the repair of performance counters. Let's check if you can get the information again.

Image

Repair Windows Corrupted System Files

Press “Windows + X” and select “Windows PowerShell (Admin)”

Code: Select all

DISM.exe /Online /Cleanup-image /Restorehealth

sfc /scannow
Image

Image
Last edited by ryouji on October 6th, 2023, 6:39 am, edited 1 time in total.
marcelmira
Posts: 1
Joined: August 12th, 2020, 3:39 pm

Re: ModernGadgets 1.6.3

Post by marcelmira »

Thank You raiguard for the excellent work.

I can't live without Modern Gadgets anymore on my second monitor. :)

Any chances that you include GPU POWER in Watts (Included on HWiNFO64) in the GPU Meter? I think that to see the live consumption of the GPU is very important. Maybe for others too.
opvan
Posts: 2
Joined: August 15th, 2020, 8:21 pm

Re: ModernGadgets 1.6.3

Post by opvan »

Hi, I just downloaded Rainmeter and ModernGadgets today. I notice that in this gadget the CPU usage doesn't match the Windows 10 task manager's CPU usage. Is there a way I can fix this ? Thanks.
User avatar
Alex88
Posts: 92
Joined: July 18th, 2020, 1:23 am
Location: California

Re: ModernGadgets 1.6.3

Post by Alex88 »

opvan wrote: August 15th, 2020, 8:26 pm Hi, I just downloaded Rainmeter and ModernGadgets today. I notice that in this gadget the CPU usage doesn't match the Windows 10 task manager's CPU usage. Is there a way I can fix this ? Thanks.
I'd wait for raiguard to give the proper answer/insight as it's his suite, but to help in the meantime: what numbers/deviation are you getting between what's shown on Modern Gadgets and what's shown in the Task Manager? I downloaded Modern Gadgets and checked it's CPU usage along with a separate measure checking the CPU (measureCPU) and it seems pretty close. The Rainmeter measures jump around a bit more but it looks like maybe a percent or two difference from what's shown in the Task Manager, but that happens with any external monitoring application I've seen. Task Manager seems to update first, then the Rainmeter measures update a cycle after that. If there's a significant difference in your CPU usage numbers past a few percent, I can't currently think of what would cause it, should still be close even with other skins loaded.

Click to animate:
ModernGadgetsCPU.gif
You do not have the required permissions to view the files attached to this post.
opvan
Posts: 2
Joined: August 15th, 2020, 8:21 pm

Re: ModernGadgets 1.6.3

Post by opvan »

Thank you for the promp reply Alex. I tried a few other skins that has the CPU monitor feature and all of them were 10%-20% lower than what task manager reported. I think there's something wrong with my settings that's causing all the skins to be off on the CPU monitor. I've given up and have moved on the Process Meter module of Modern Gadgets. I found this module to be more useful since it shows the top 10 process and also has a graph to show CPU usage underneath.
brellyn
Posts: 8
Joined: August 29th, 2020, 10:16 pm

Re: ModernGadgets 1.6.3

Post by brellyn »

I've just updated my GPU and I've gotten most of the addressing correct, but I'm having an issue with the VRAM section. I've looked through HWINFO but can't make out this section and I don't want to start experimenting. The card is an nVidia GTX 1070ti, which has been around for quite a while. The VRAM section shows changes in usage by %, But used and max display null values. This is an 8GB card.

Also, is there a way to capture the encoder performance? (Turing cards have a single onboard nvenc encoder chip).
You do not have the required permissions to view the files attached to this post.
User avatar
SilverAzide
Rainmeter Sage
Posts: 2603
Joined: March 23rd, 2015, 5:26 pm

Re: ModernGadgets 1.6.3

Post by SilverAzide »

brellyn wrote: August 29th, 2020, 10:32 pm I've just updated my GPU and I've gotten most of the addressing correct, but I'm having an issue with the VRAM section. I've looked through HWINFO but can't make out this section and I don't want to start experimenting. The card is an nVidia GTX 1070ti, which has been around for quite a while. The VRAM section shows changes in usage by %, But used and max display null values. This is an 8GB card.

Also, is there a way to capture the encoder performance? (Turing cards have a single onboard nvenc encoder chip).
What's wrong with a little experimenting? Nothing's gonna blow up or melt down if you get a value wrong... :)
For the VRAM section, usually on nVidia cards HWiNFO will have an entry with a name that is something like "GPU Memory Allocated". This is the one you want. You've correctly set the "GPU Memory Usage" entry ID, since that is displaying properly. Hardware is all different, so no one can tell you the exact settings for your particular combination of hardware.

As far as encoder performance goes, you can report on it if HWiNFO can see it. If it is something HWiNFO can monitor, then obviously you'll need to modify the GPU Meter skin or use a generic HWiNFO skin that monitors whatever you configure it to do (like this one).
Gadgets Wiki GitHub More Gadgets...
brellyn
Posts: 8
Joined: August 29th, 2020, 10:16 pm

Re: ModernGadgets 1.6.3

Post by brellyn »

Success! That was the value I couldn't find... memory alloc. I kept trying to find vram something...

Thanks! :yahoo:
You do not have the required permissions to view the files attached to this post.
richjackman242
Posts: 3
Joined: August 1st, 2020, 4:46 pm

Re: ModernGadgets 1.6.3

Post by richjackman242 »

How do I use the event countdown. I can set the name and time, but how do I start the countdown?
User avatar
raiguard
Posts: 660
Joined: June 25th, 2015, 7:02 pm
Location: The Sky, USA

Re: ModernGadgets 1.6.3

Post by raiguard »

richjackman242 wrote: September 18th, 2020, 7:31 pm How do I use the event countdown. I can set the name and time, but how do I start the countdown?
Check the "show event countdown" checkbox near the top of the settings skin.
”We are pretty sure that r2922 resolves the regression in resolution caused by a reversion to a revision.” - jsmorley, 2017