Hi All,
I've noticed a rather large discrepancy between my resource monitor's supposed CPU usage and Rain Meter's. What's causing the discrepancy?
Ansible
It is currently April 16th, 2024, 10:02 am
Discrepancy Between Rainmeter and Resource Monitor
-
ansible
- Posts: 3
- Joined: November 11th, 2018, 11:49 pm
Discrepancy Between Rainmeter and Resource Monitor
You do not have the required permissions to view the files attached to this post.
-
eclectic-tech

- Rainmeter Sage
- Posts: 5391
- Joined: April 12th, 2012, 9:40 pm
- Location: Cedar Point, Ohio, USA
Re: Discrepancy Between Rainmeter and Resource Monitor
The illustro skin you are using measures the average of all CPU cores.
The UsageMonitor plugin will give you more accurate results.
The UsageMonitor plugin will give you more accurate results.
:: My DA Gallery :: Rainmeter DA Gallery :: Rainmeter Workshops :: Rainmeter Documentation :: BBCode Guide ::
-
ansible
- Posts: 3
- Joined: November 11th, 2018, 11:49 pm
Re: Discrepancy Between Rainmeter and Resource Monitor
Are you sure that's what's going on? When I check the resource monitor, all 8 cores are at max.eclectic-tech wrote: ↑November 12th, 2018, 2:37 am The illustro skin you are using measures the average of all CPU cores.
The UsageMonitor plugin will give you more accurate results.
-
eclectic-tech
- Rainmeter Sage
- Posts: 5391
- Joined: April 12th, 2012, 9:40 pm
- Location: Cedar Point, Ohio, USA
Re: Discrepancy Between Rainmeter and Resource Monitor
I am sure that skin shows the average and that the UsageMonitor will give you accurate individual core values.
I am not sure why your overclocked core's are all over 80%.
You should check to see what is causing the excessive load
or you could wait until it looks like this...
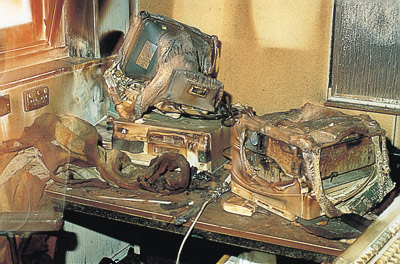
Then go buy a new one!
I am not sure why your overclocked core's are all over 80%.
You should check to see what is causing the excessive load
or you could wait until it looks like this...
Then go buy a new one!
:: My DA Gallery :: Rainmeter DA Gallery :: Rainmeter Workshops :: Rainmeter Documentation :: BBCode Guide ::
-
ansible
- Posts: 3
- Joined: November 11th, 2018, 11:49 pm
Re: Discrepancy Between Rainmeter and Resource Monitor
I'm doing some relatively intensive computing at the moment so it's expected. What's not expected is the rainmeter-resource divergence. Thanks for your help.eclectic-tech wrote: ↑November 12th, 2018, 11:34 am I am sure that skin shows the average and that the UsageMonitor will give you accurate individual core values.
I am not sure why your overclocked core's are all over 80%.
You should check to see what is causing the excessive load
or you could wait until it looks like this...
Then go buy a new one!
-
SilverAzide

- Rainmeter Sage
- Posts: 2601
- Joined: March 23rd, 2015, 5:26 pm
Re: Discrepancy Between Rainmeter and Resource Monitor
I don't think there is a discrepancy, actually. If you notice in your screenshot, your CPU is running overclocked (138%). Rainmeter is asking Windows for the CPU usage value, and Windows is responding with a value based on the overclocked frequency (i.e., 138% of normal).
So if you take the 78% value from Resource Monitor and reduce it by 38% (78 x .38), you get 29.64%... which is exactly what Rainmeter is showing, rounded to 30%.
Or to think of it another way, if your CPU was not overclocked, it would be at 78% (as shown), but since it IS overclocked, it's only at 30% of it's maximum capability.
-
eclectic-tech
- Rainmeter Sage
- Posts: 5391
- Joined: April 12th, 2012, 9:40 pm
- Location: Cedar Point, Ohio, USA
Re: Discrepancy Between Rainmeter and Resource Monitor
Thanks SilverAzide
I agree that this is a combination of averaging all cores and overclocking the CPUs that is causing the discrepancy.
{Deleted section the 'new' math is beyond me!}
I have seen overclocking cause very strange results when trying to measure.
I agree that this is a combination of averaging all cores and overclocking the CPUs that is causing the discrepancy.
{Deleted section the 'new' math is beyond me!}
I have seen overclocking cause very strange results when trying to measure.
:: My DA Gallery :: Rainmeter DA Gallery :: Rainmeter Workshops :: Rainmeter Documentation :: BBCode Guide ::